SQLBeat's built-in alerting system is rule based and table driven. Rules are business-hours aware and can be directed to any number of users, and for each any number of email addresses. Category, as well as regular expression matching is available to select messages.
All automated monitoring output passes through a single rules engine, allowing customized delivery based on server, application, message text or type.
SQLBeat's integrated ASP.net based Dashboards allow you to easily query and configure monitoring of both Enterprise and SQL resources.
Included with the base SQLBeat implementation are Enterprise and SQL Server dashboards, which provide access to reports including:
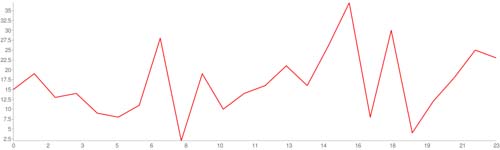
| Active Connections |
Shows the number of connections to your SQL Server, graphed over time |
 |
| Page Life Expectancy |
Shows SQL's overall page life expectancy measure, graphed over time |
 |
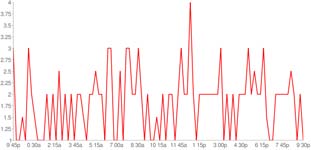
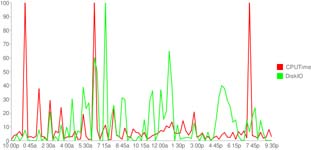
| Server CPU and Disk Load by Hour |
Shows relative CPU and Disk load over time |
 |
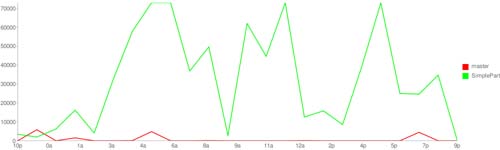
| Relative CPU Load by Database |
Shows the relative CPU load per database over time |
 |
| Relative Disk Load by Database |
Shows the relative Disk load per database over time |
 |
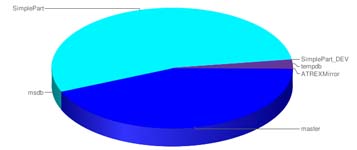
| Relative CPU Load by Database |
Shows the relative CPU load per database over the last 24 hours in a pie chart |
 |
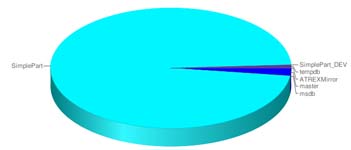
| Relative Disk Load by Database |
Shows the relative Disk load per database over the last 24 hours in a pie chart |
 |
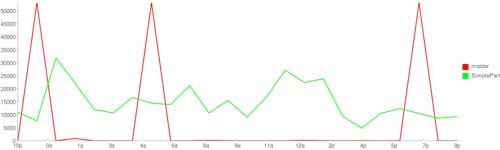
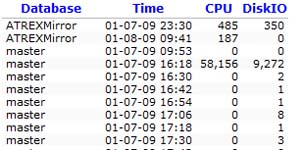
| CPU and Disk Load by Database |
Shows a minute-by-minute summary of CPU and Disk activity totals per database |
 |
| SQL Job History |
Breaks the previous 24 hours down into 5 minute windows, and shows whats jobs were running during each window |
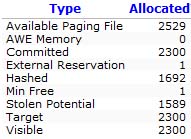
| SQL Memory Allocation |
A report on SQL Server's current state of memory |
 |
| Long Running Queries |
Lists long running queries observed |
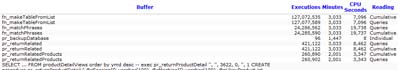
| Query Load |
Shows the top queries running and the respective CPU and Disk load each generates |
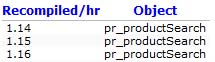
| Frequently Recompiling Queries |
Shows the top recompiled stored procedures, functions and ad-hoc queries |
 |
| Remote Queries |
Shows the top queries accessing remote resources or from remote sources |
| Most run queries |
Shows the queries most often run over the last 48 hours |
| Parallelism |
Shows queries that have blocked themselves due to parallelism |
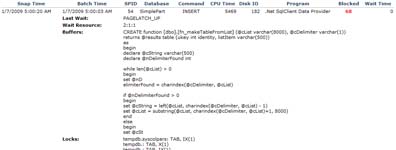
| Blocked Queries |
Showing the buffer contents and locks status of the queries most often seen to be blocked |
| Blocking queries |
Showing the buffer contents and block duration of the queries most often seen to be blocking |
| Blocking Event Detail |
Shows instances of blocking and locks held by blocker/blockee |
 |
| Query CPU Cycles |
Shows top query CPU consumers |
 |
| Query CPU Load by Hour |
Shows top query CPU consumers by hour |
| Query Disk IO |
Shows top query Disk IO consumers in the previous few hours |
| Query Disk IO |
Shows top query Disk IO consumers in the previous 48 hours |
| Process Waits |
Shows a historical breakdown (wait time and frequency) of SQL Server's wait types, compared to a rolling 24 hour window |
| Server Waits |
Shows a breakdown of sever level waiting, including disk, memory and internal factors |
| CPU Waits |
Shows the times when CPU waiting was observed within the last 48 hours |
| Disk Waits |
Shows the times, database files and disks where Disk waiting was observed within the last 48 hours |
| Disk Waits by Hour |
Shows the number of requests and waiting time, broken down into hour windows aggregated over the last few days |
 |
| Buffer Cache - Current Contents |
Shows a list of the tables/indexes currently in buffer cache memory, and how many buffers each consumes |
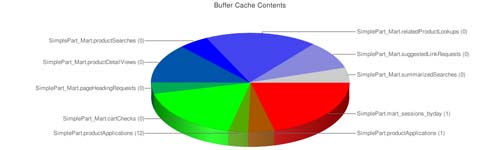
| Buffer Cache Contents (pie) |
Shows a pie graph of the objects current in buffer cache memory |
 |
| Buffer Cache History |
Shows a table/index breakdown of buffer cache activity, including high/low number of buffers consumed, as well as an overall buffer cache i/o delta |
| Buffer Cache Table History |
Shows a table-rollup of the Buffer Cache History report |
| Buffer Cache Database History |
Shows a database-rollup of buffer cache activity, including high/low number of buffers consumes as well as an overall buffer cache i/o delta |
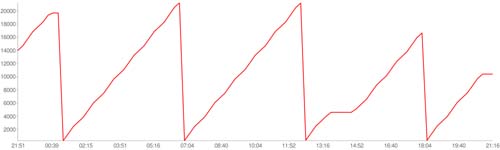
| Database Growth Summary |
Shows a summary of the beginning and ending sizes for each database |
| Database Weekly Growth |
Shows a weekly summary of database growth, broken down by week |
| Database Growth Event History |
Shows a list of the times when database files changed in size over the previous week |
| Backup Summary |
Shows when each database was last backed up, where it was backed up and what the size on disk of the backup was |
| Database Activity Summary |
Shows a summary of table and index activity, aggregated by database. This includes total table rows, buffer cache entries, index scans, index seeks, index updates and bookmark lookups |
| Database Last User Activity |
Shows the last recorded date of user activity in each database |
| Table Fragmentation |
Shows the results of the most recent table fragmentation scan |
| Table Sizes |
Shows the number of rows, data and index size for tables in all databases |
| Index 24 Hour Summary |
Shows count of scans, seeks, updates and lookups performed on each index in the past 24 hours |
| Index Week Summary |
Shows count of scans, seeks, updates and lookups performed on each index in the past week |
| Missing Indexes |
Identifies tables where there are a large number of table scans or index scans as potentially needing new indexes |
| Indexes Not Used |
Identifies indexes where there are a large number of updates and few seek/scan/lookup operations |
| Bookmark Scans |
Identifies indexes where there are a large number of bookmark scans, suggesting that a clustered index may be misplaced | |